WATER SURFACE MAPPING: METHOD SUMMARY
Here we present a summary of the MapBiomas Water Method. Access the ATBD (Algorithm Theoretical Basis Document ) in this link for more methodological details.
Presentation
The main objective of MapBiomas Water is to map the dynamics of surface water throughout the territory of the Amazonian countries (Pan-Amazonia), on a monthly and annual basis from 1985 to 2022. The dataset is publicly available on a web platform to improve the management and use of water resources across Pan-Amazonia.
The surface water mapping in the Amazonian countries utilized all Landsat satellite scenes with cloud coverage of less than or equal to 70% and a spatial resolution of 30 meters. The mapping was conducted at a sub-pixel scale (SWSC) using Spectral Mixture Analysis (SMA) and empirical classification rules based on fuzzy logic. The mapping covered the period from 1985 to 2022 on a monthly scale, with a total of 396,000 Landsat scenes processed and analyzed on the Google Earth Engine platform.
Organization and database
The overall coordination of MapBiomas Water is led by Imazon and RAISG, while technical and operational coordination is directed by Geokarten. The reconstruction of the monthly historical series of surface water was carried out by specialists from all biomes of the Amazonian countries, under the leadership of the following institutions: Fundación Amigos de la Naturaleza -FAN- (Bolivia), Fundación Gaia Amazonas -FGA- (Colombia), EcoCiencia (Ecuador), Instituto del Bien Común -IBC- (Perú), Provita y Wataniba (Venezuela), Alliance of Bioversity International y CIAT (Guianas y Suriname). The surface water mapping algorithm was developed by Imazon and adapted by MapBiomas Water in this initial phase of work.
The development of the MapBiomas Water control panel (dashboard) was conducted by Geodatin and includes significant contributions from the MapBiomas Water working group and platform users in the design thinking process.
Three types of products were produced by MapBiomas Water:
- Monthly and annual surface water maps;
- Surface water transition maps between “Water” and “Non-water” classes. This product was processed using the annual surface water database;
- Trend maps (increase and decrease) in surface water. This product was calculated from monthly surface water data in 5 km x 5 km grids.
The dashboard (link) consists of maps, statistics, and visualization, analysis, and data access tools. It is possible to view the data on an annual and monthly scale, as well as obtain it in different territorial units. Finally, the dashboard also provides a link to access the MapBiomas Water data API.
Method
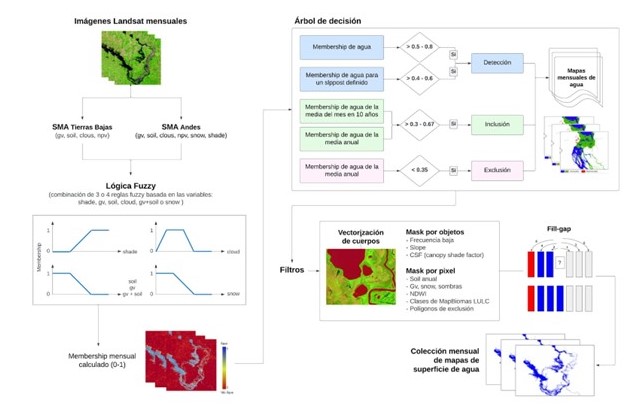
The following diagram illustrates the main stages in the process of classifying surface water in the Amazonian countries, involving a surface water sub-pixel classifier (SWSC), decision tree, and post-classification procedures to generate annual and monthly surface water datasets.
Figure 1 – Stages of surface water classification.
Description of classification steps:
- Pre-processing: Consists in the selection of Landsat scenes from the sensors: Landsat 5 Thematic Mapper (TM), Landsat 7 Enhanced Thematic Mapper Plus (ETM+), and Landsat 8 Operational Land Imager (OLI); applying cloud and shadow masking to each scene and excluding scenes with more than 70% cloud cover. The visible, near and mid-infrared spectral bands were selected for the application of the Mixture Spectral Model (MEM). The result of the MEM is a set of compositional bands for each pixel of the Landsat image, for the Vegetation, Non-Photosynthetically Active Vegetation (NPV), Soil, Shade, and Cloud components. Water behaves as a dark body (i.e. low reflectance) in Landsat images and therefore has a high percentage of the Shadow component in the pixel. The edges of lakes, rivers, and humid environments, such as floodplains, present a mixture of Shadow (water), Vegetation, and Soil, which allows the detection of water in environments with these types of materials.
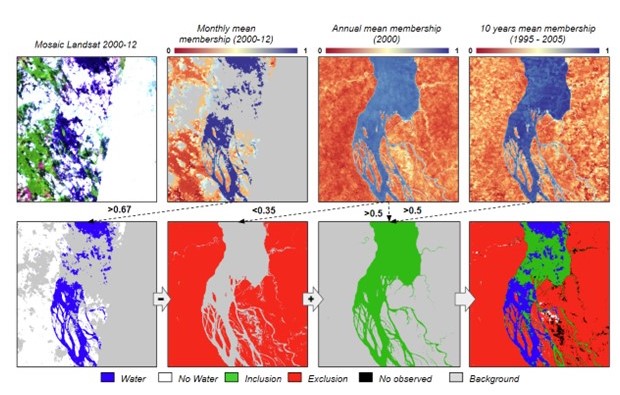
- Classification of Water Surface: It’s based on MEM compositional bands and fuzzy decision rules to obtain association maps (Water Membership) of water occurrence in the Landsat pixel. The monthly maps were obtained by combining the Water Membership values for i) a given month (detection) where pixels with a value > 0.67 are considered water; ii) the decennial of the month under analysis and the average of the year (inclusion) where pixels with a value > 0.5 are considered water; iii) the average of the year (exclusion) pixels with values < 0.35. Figure 2 illustrates the monthly ranking process.
Figure 2 – Example of detection, inclusion and exclusion of information applied to the mapping of monthly surface water.